Stratpoint Technologies · Data Engineering Internship · Jun — Aug 2026
Movie Analytics Warehouse
Pricing film-production insurance from a 45,433-title catalog
An end-to-end ELT pipeline that turns three messy source files into a 20-model dimensional star schema, built for exactly one reader: a specialty-insurance underwriter deciding what premium to quote on a film.
- dbt models · 3 layers
- 20
- full warehouse rebuild
- 1m22s
- dbt tests
- 104
- usable data
- +105%
- faster core query
- 27%
- smaller index
- 76%
01
Built for one reader
This is not a generic movie-analytics project. It answers six numbered business questions for a single stakeholder — a specialty-insurance underwriter deciding what premium to quote on a production — and every figure in the seven-page Power BI report traces back to a raw file or a logged correction.
Framing it that way settled arguments early. A metric that no underwriter would act on did not get built, however interesting it looked.
02
The pipeline
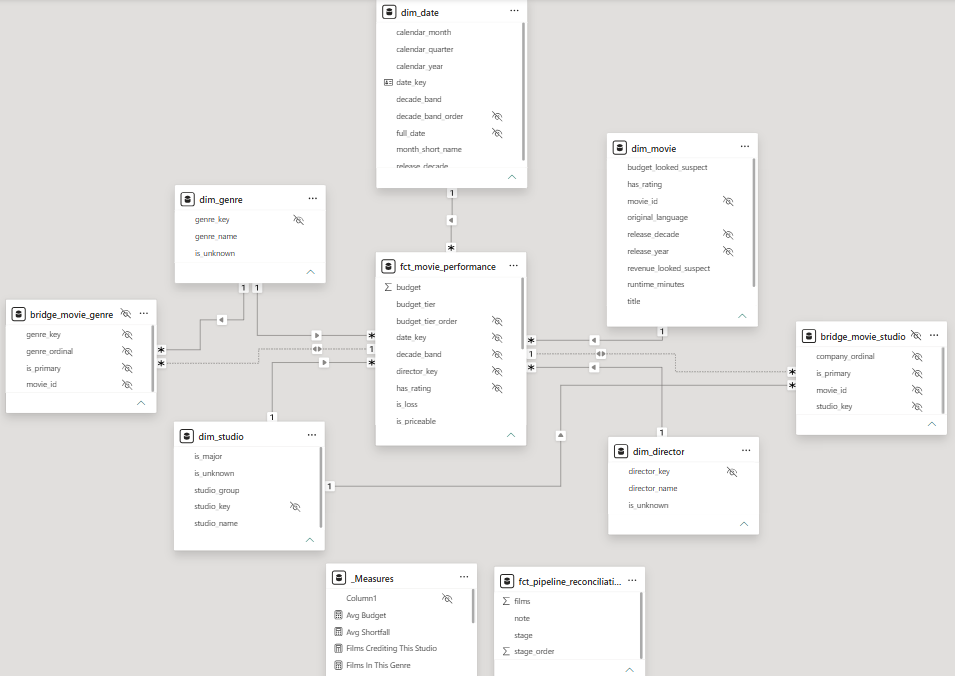
Three raw files (45,486 rows) are cleaned and TMDB-verified in Pandas, loaded by PySpark into PostgreSQL 16 and Parquet, then modelled by dbt across three layers — staging and intermediate as views, marts as tables — into a star schema of three facts, five dimensions and two bridges.
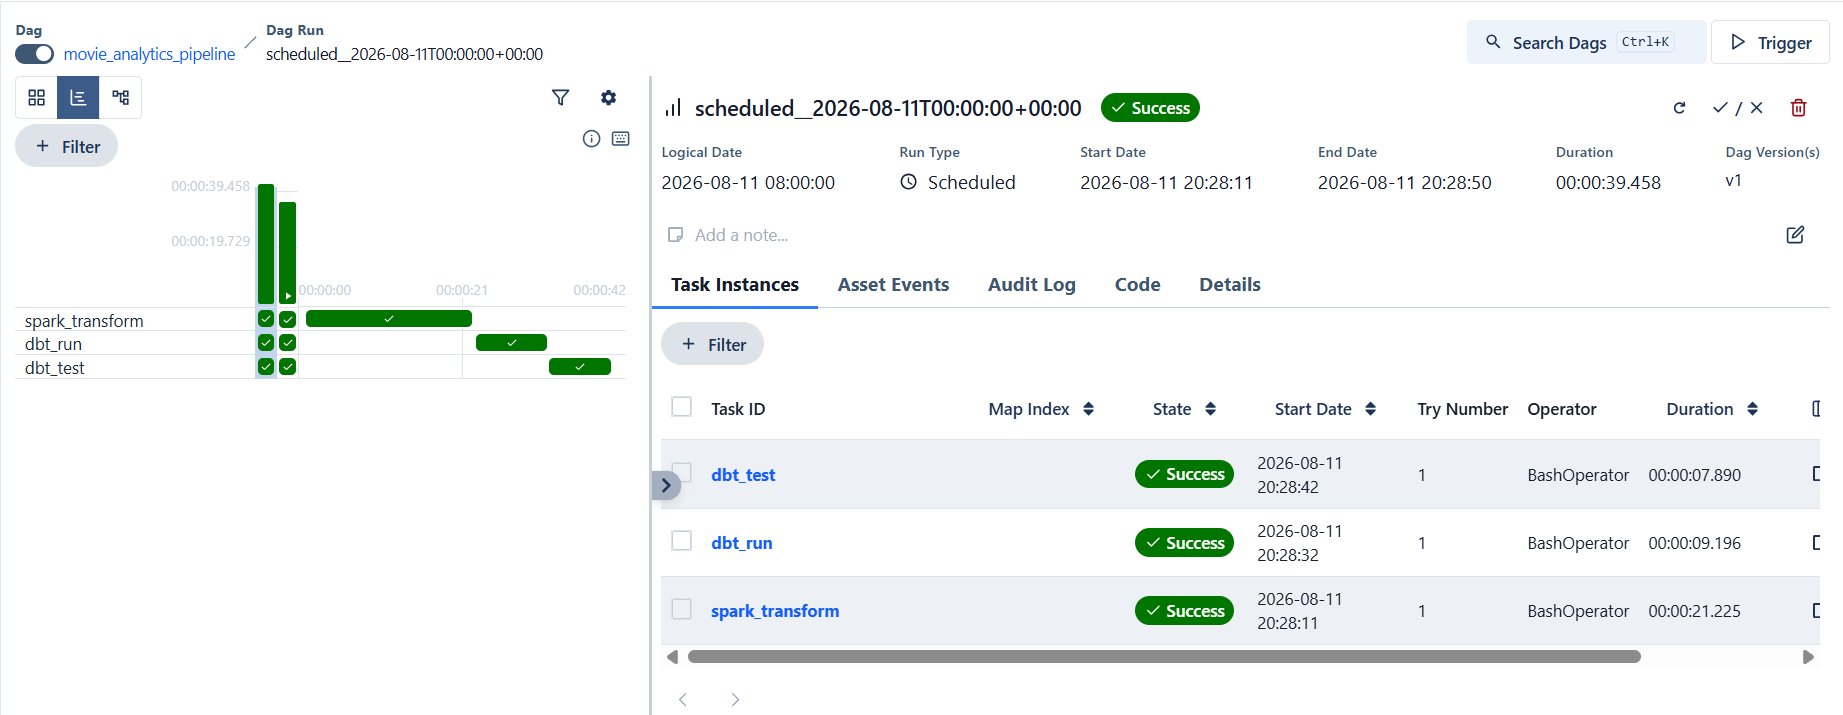
Airflow orchestrates it as four strictly linear tasks: spark_transform → dbt_seed → dbt_run → dbt_test. dbt and PySpark live in separate virtualenvs called by absolute path, so neither can break Airflow's own pinned dependencies.
03
Quarantine, never delete
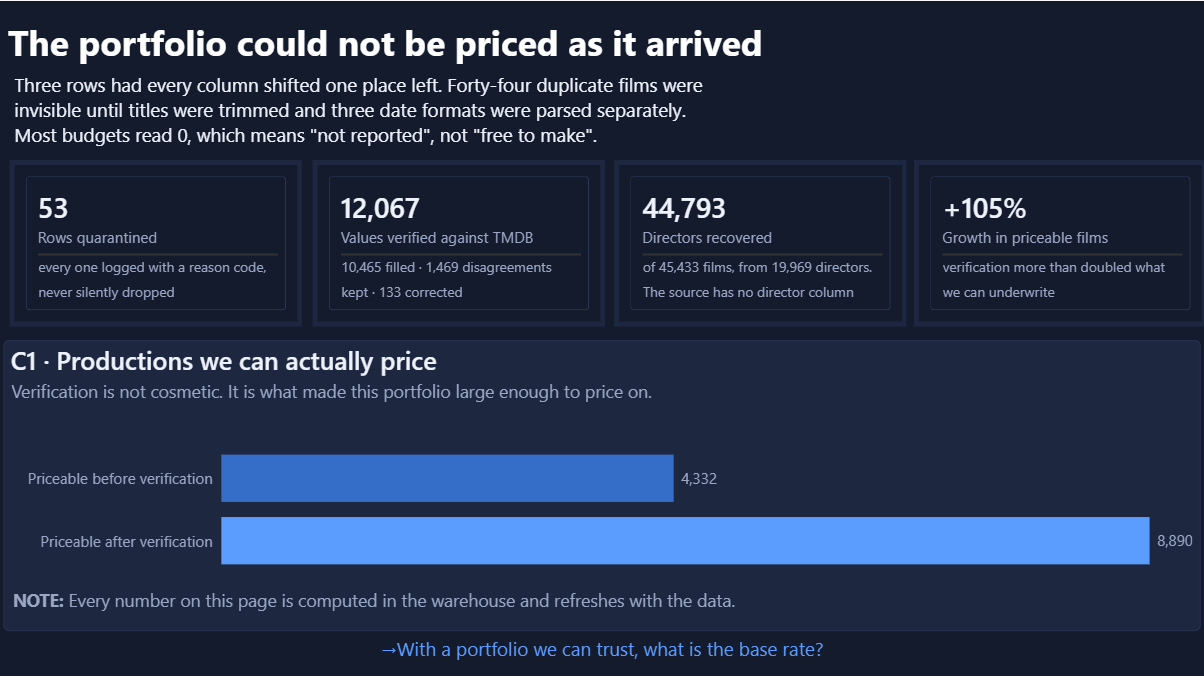
Every rejected row goes to a quarantine file with one of four reason codes, is loaded back into the warehouse as a table, and surfaces on the dashboard's data-trust page. That page reads its numbers from tables rather than text boxes — there is a fact table whose entire purpose is to make the "12,067 values reconciled" card a query result instead of a typed constant.
The order of operations mattered more than the dedupe itself. A plain drop_duplicates found 6 rows. Normalising titles and parsing three date formats explicitly first exposed 44 more that a naive pass would have kept.
The bug I'm most glad I caught was invisible to every automated check: 227 films stored their production company inverted — "Jim Henson Company,The" — which invented a company literally named "The" and attached it to 224 films. No row count and no foreign-key test could see it. It turned up in an aggregate a human actually read.
04
Idempotency, and proving it
Every dimension key is a hash of the natural name, not a row number. That one choice is what makes a rebuild a refresh: row-number keys would be reassigned on every run, and all nine relationships would silently repoint to different dimension members with no error anywhere.
Two other mechanisms back it up — a truncating JDBC write so Spark cannot drop and recreate tables with the wrong column types, and a reconciliation test that guards the specific failure mode table-materialised marts have: views collapse loudly when their source disappears, but marts survive a failed rebuild full of yesterday's numbers, looking perfectly healthy.
The proof was a drill. Five schemas dropped, one Airflow trigger, all four tasks green on the first try in 1m22s, 104 dbt tests passing identically, and a verification query diffing byte-identical across ten mart row counts, six headline figures, five budget tiers and eight studio groups.
05
The index that did nothing
I shipped the schema deliberately without the obvious index so there would be a genuine before-and-after to measure. When I finally created it, the planner ignored it completely — same plan node for node, same 6,691 rows discarded, same 935 buffers.
The diagnosis: a plain year index reads about 10,300 films in range and then throws away roughly 8,100 that aren't priceable, which is worse than the path already being used. The fix was a partial index restricted to priceable rows, matching both predicates so the filter node disappears entirely — 20.5ms to 14.9ms, and the index itself 336kB to 80kB.
I ran three passes per stage, reported the median, vacuumed between stages, and quoted buffer counts next to timings because the table is small enough to live in shared buffers and wall time is noisy. The honest framing is in the write-up: 21ms to 15ms is 27%, not an order of magnitude, because there was no disk I/O to save. An index that covers one of two predicates is not half an optimisation — it is dead weight.
06
What the data actually said
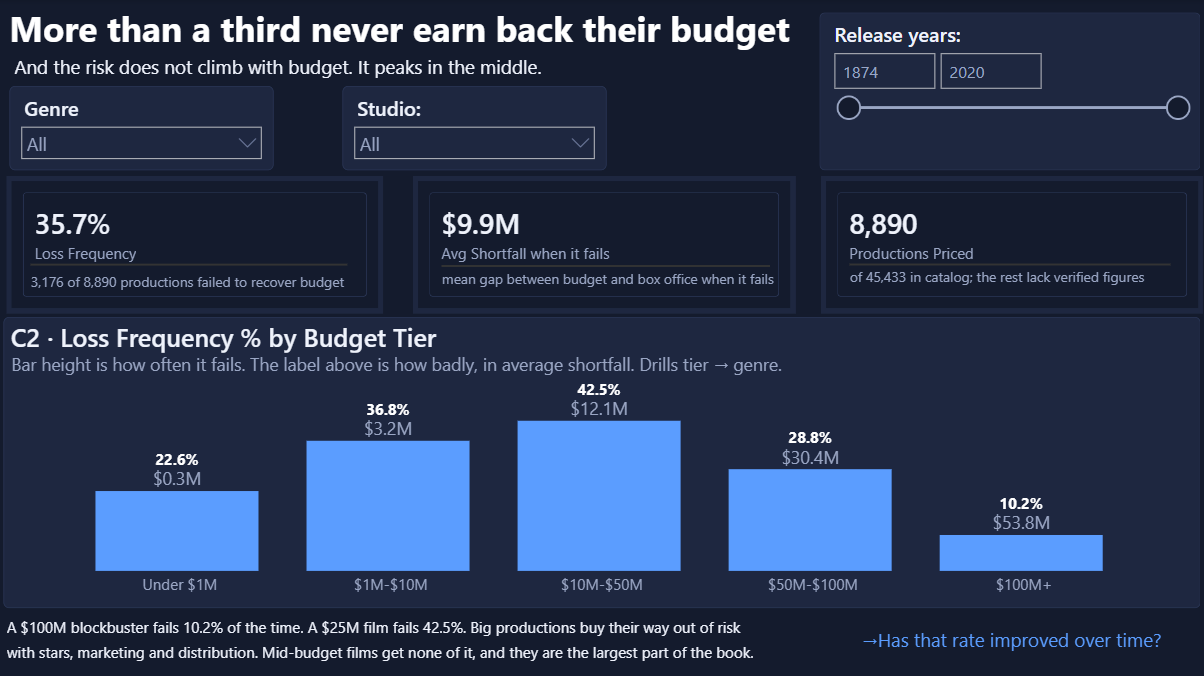
Verification changed the answer. The raw data showed a 30.0% failure rate; once 12,067 field values were reconciled against TMDB and the priceable set nearly doubled, the true rate was 35.7%.
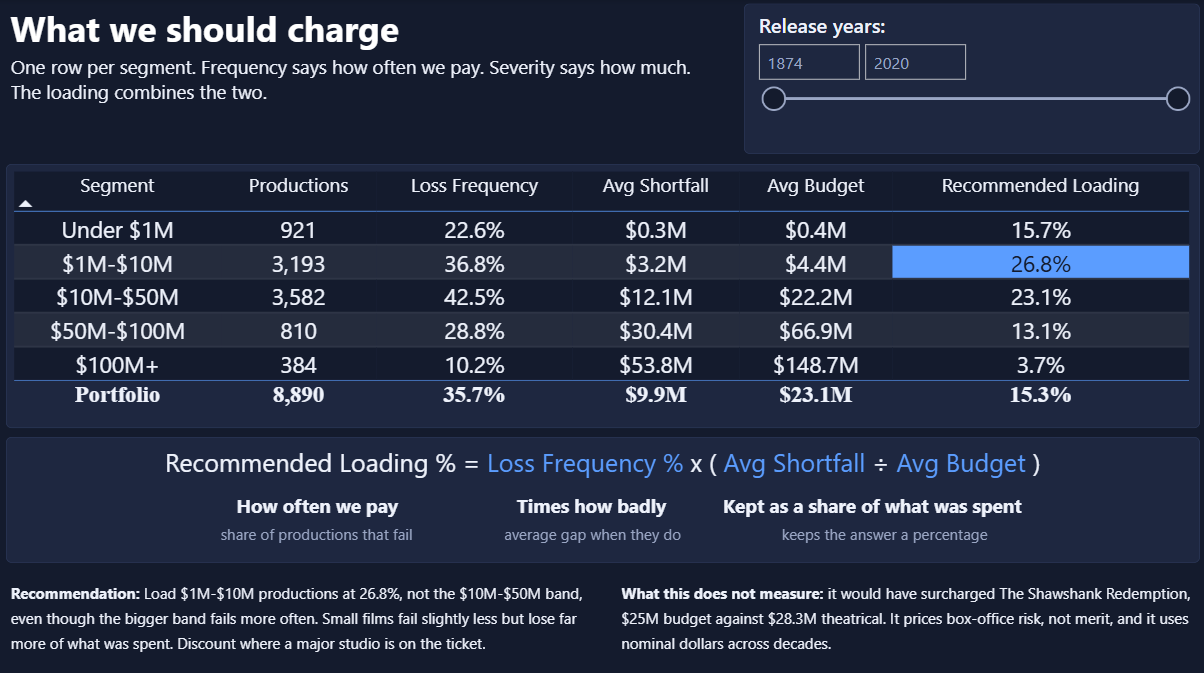
And the risk is not where intuition puts it. Mid-budget productions fail most — films between $10M and $50M lose money 42.5% of the time, while films over $100M fail only 10.2% of the time. The dangerous quote is the middle of the range, not the top.